ADVERTISEMENT
[ Placeholder for future Google AdSense block ]
Conceptual Diagram: The Functional Map of Agile Engineering Management
One of the key tools in Agile Engineering Management is the Conceptual Diagram, which defines and visualizes the seven core functions that drive engineering management in EPC projects. More than just a schematic, it serves as a map of responsibility, eliminating duplication, ambiguity, and functional conflicts.
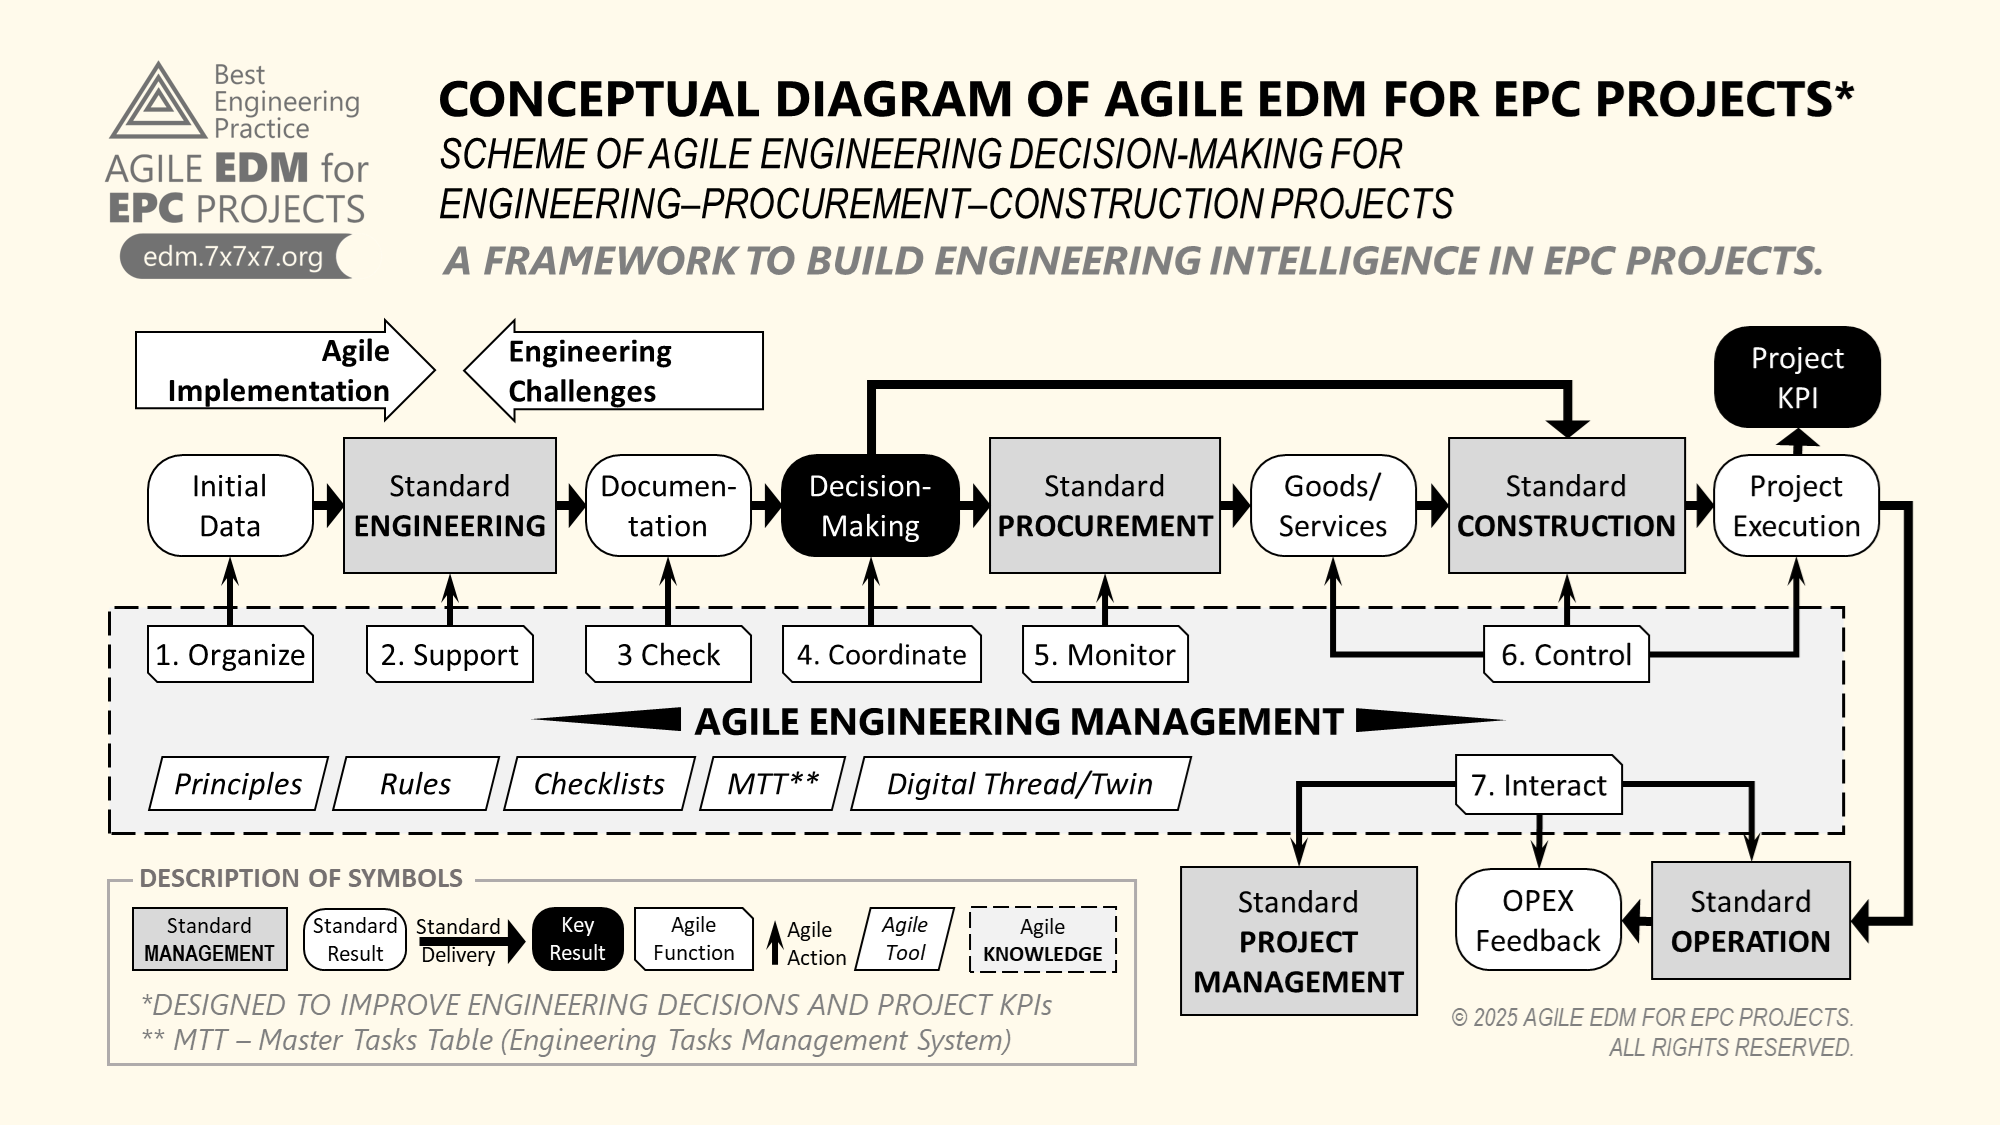
In traditional engineering practice, roles and responsibilities across functions often overlap. This leads to confusion, duplicated efforts, delays, and inefficiencies in the decision-making and execution processes. Teams struggle to understand who is responsible for what, which tasks require collaboration, and where handovers are supposed to happen.
The Conceptual Diagram resolves this issue by clearly delineating the boundaries and content of each function. It defines the nature of the tasks, the role of each function, and its influence on the overall engineering workflow. As a result, it becomes possible to:
- Assign clear ownership to each function without overlaps,
- Measure and monitor progress within each functional area,
- Develop dedicated tools and rules tailored to each function,
- Coordinate interactions between functions within a unified project information system.
By implementing the Conceptual Diagram, Agile Engineering Management gains structural clarity and operational coherence, ensuring that each participant understands their role, their tools, and their deliverables. This clarity eliminates friction, enabling EPC projects to move forward without bottlenecks or breakdowns.
Diagram as Conceptual Tool
The Conceptual Diagram of Agile EDM for EPC Projects is more than just a schematic — it is a strategic lens into the systemic logic of engineering decision-making across Engineering, Procurement, and Construction (EPC) projects. It visualizes the gaps, transitions, and dependencies among five standard management areas — Engineering, Procurement, Construction, Operation, and Project Management — and shows how Agile Engineering Management addresses the real-world inconsistencies that arise between them.
Traditional project schematics often assume ideal conditions: clear interfaces, complete data, and consistent responsibility handovers. But in practice, standard management functions tend to break down at the seams, especially in areas where information is poor, interfaces are unclear, or accountability is fragmented. This is exactly where the Agile EDM Conceptual Diagram comes into play — it reveals where Agile Functions like coordination, monitoring, and feedback become essential for maintaining project continuity and quality.
At its core, this diagram demonstrates how Agile Engineering Management serves as a backbone supporting and strengthening the standard chain of EPC functions through seven embedded Agile Functions, five Agile Tools, and direct connection with project KPIs. These are not theoretical add-ons — they are practical response mechanisms that already exist in real projects, though often informally or inefficiently.
Thus, the diagram serves three critical purposes:
- Diagnose: It helps project teams recognize where breakdowns occur.
- Design: It guides the intentional implementation of agile support processes.
- Deliver: It clarifies how engineering contributes to measurable project outcomes (KPIs).
If you’re involved in engineering or managing EPC projects, understanding this diagram is the first step toward transforming your existing practices into a more resilient, responsive, and intelligent system of decision-making.
Links Summary
- Agile Engineering Tools: https://edm.7x7x7.org/agile-engineering-management/agile-tools/
- Conceptual Diagram of Agile EDM: [Located on the same page above]
- Agile Engineering Management (parent concept): https://edm.7x7x7.org/agile-engineering-management/
- Standard Project Management: https://edm.7x7x7.org/standard-management/standard-project-management/
- What Is an EPC Project (System Definition): https://edm.7x7x7.org/epc-project-as-system/
- Project KPIs (Wikipedia): https://en.wikipedia.org/wiki/Performance_indicator
- Engineering Decision-Making (Wikipedia): https://en.wikipedia.org/wiki/Engineering_design_process
- Systems Thinking (Wikipedia): https://en.wikipedia.org/wiki/Systems_thinking
Integrated Framework Across Standard Domains
At the system level, the Conceptual Diagram of Agile EDM for EPC Projects maps the interactions among five standard management domains — Standard Engineering, Procurement, Construction, Operation, and Project Management. These functions traditionally operate in silos, guided by formal documentation, rigid contracts, and departmental mandates. While each domain has a defined role and workflow, their real-world interaction is rarely smooth or linear.
The Agile EDM diagram reveals that engineering decisions affect not just engineering, but ripple across procurement choices, construction execution, operational reliability, and project-level control systems. However, the standard interfaces between these domains — such as specifications, drawings, or schedules — often fail to reflect the dynamic complexity of real projects. The result is a cascade of misalignment: procurement buys before engineering is complete; construction proceeds without complete design context; operation inherits systems with unresolved issues.
To address these issues, Agile Engineering Management introduces an integrated layer that crosses domain boundaries. This layer is built around seven Agile Functions:
- Organize
- Support
- Check
- Coordinate
- Monitor
- Control
- Interact
Each of these functions plays a bridging role, acting as an active interface that ensures decision continuity across project phases.
Additionally, the diagram includes Agile Tools such as:
- Principles
- Rules
- Checklists
- MTT – Master Tasks Table
- Digital Thread/Twin
These tools are not external add-ons. They are embedded into the system as shared knowledge structures, ensuring that teams stay aligned on goals, progress, and quality standards.
This interconnected design turns the Agile EDM Diagram into a multi-domain systems map, not just for visualizing the project but for actively managing its moving parts.
Links Summary
- Agile Engineering Functions: https://edm.7x7x7.org/agile-engineering-management/agile-functions/
- Agile Tools (page): https://edm.7x7x7.org/agile-engineering-management/agile-tools/
- MTT – Master Tasks Table: https://edm.7x7x7.org/mtt-master-tasks-table/
- Standard Engineering: https://edm.7x7x7.org/standard-management/standard-engineering/
- Standard Procurement: https://edm.7x7x7.org/standard-management/standard-procurement/
- Standard Construction: https://edm.7x7x7.org/standard-management/standard-construction/
- Standard Operation: https://edm.7x7x7.org/standard-management/standard-operation/
- Project Management Principles (Wikipedia): https://en.wikipedia.org/wiki/Project_management
- System Integration (Wikipedia): https://en.wikipedia.org/wiki/System_integration
Deconstructing the Agile EDM Diagram
This section takes a closer look at the Agile EDM Conceptual Diagram, unpacking its components and explaining how each contributes to engineering decision-making in EPC projects.
At the center of the diagram lies the “Agile Layer”, a dynamic interface that integrates standard management areas with agile engineering logic. This layer is made operational through seven Agile Functions:
ADVERTISEMENT
[ Placeholder for future Google AdSense block ]
- Organize – Structures the engineering context and sets priorities for decision-making.
- Support – Provides essential information, people, and tools to empower technical teams.
- Check – Ensures decisions comply with requirements, standards, and constraints.
- Coordinate – Aligns stakeholders and departments across disciplines.
- Monitor – Tracks progress and signals deviations in real time.
- Control – Applies necessary corrections to keep decisions on track.
- Interact – Facilitates feedback loops across departments and with the client.
Each function is not tied to position or department, but is expressed as an active role in the flow of engineering. In that sense, they’re similar to “microservices” in software — flexible, scalable, and purpose-driven.
Surrounding this agile layer are five standard management domains:
- Engineering
- Procurement
- Construction
- Operation
- Project Management
Each domain is represented not only as a block of responsibility but as a source and recipient of engineering decisions. For example, procurement may request technical clarification before purchase; construction may return feedback based on site conditions.
What makes this model powerful is the layer of shared tools and knowledge, which include:
- Agile Principles
- Engineering Rules
- Decision-Making Checklists
- Master Tasks Table (MTT)
- Digital Thread and Twin
These tools bridge the gap between strategy and execution. Instead of relying solely on traditional work breakdown structures or reporting hierarchies, the diagram proposes a living framework: roles, functions, and deliverables evolve through the project life cycle, while remaining anchored in a unified engineering logic.
Finally, the “External Forces” (shown at the edges of the diagram) represent the project environment — clients, regulations, technology changes, etc. This highlights that agility isn’t just internal; it’s a response to external uncertainty.
Links Summary
- Agile Functions: https://edm.7x7x7.org/agile-engineering-management/agile-functions/
- Agile Rules: https://edm.7x7x7.org/agile-engineering-management/agile-rules/
- Agile Principles: https://edm.7x7x7.org/agile-engineering-management/agile-principles/
- Agile Tools: https://edm.7x7x7.org/agile-engineering-management/agile-tools/
- Digital Twin (Wikipedia): https://en.wikipedia.org/wiki/Digital_twin
- Digital Thread (Wikipedia): https://en.wikipedia.org/wiki/Digital_thread
- Decision-Making Checklists: https://edm.7x7x7.org/decision-making-check-lists/
- MTT – Master Tasks Table: https://edm.7x7x7.org/mtt-master-tasks-table/
- Engineering Management (Wikipedia): https://en.wikipedia.org/wiki/Engineering_management
Practical Use of the Agile EDM Diagram
The Agile EDM Conceptual Diagram is not just a visual abstraction — it serves as a practical compass for engineering decision-making in real projects. Let’s examine how it supports day-to-day decisions across typical EPC contexts:
Example 1: Unexpected Soil Conditions During Foundation Work
In a metro tunnel project, geotechnical teams discover soil instability not predicted in earlier surveys. Standard construction processes pause, awaiting redesign.
- The “Check” function evaluates if original design assumptions still hold.
- The “Support” function supplies updated soil data and suggests stabilization options.
- The “Coordinate” function brings engineering, procurement, and client stakeholders together to revise specifications and budget.
Thanks to the agile decision loop, actions are fast-tracked without waiting for complete redesign packages.
Example 2: Delays in Equipment Delivery
A refinery project faces delay in receiving critical pumps due to global supply chain issues.
- The “Monitor” function flags deviation from the delivery schedule.
- The “Control” function launches an investigation and proposes interim workarounds.
- The “Organize” function reprioritizes site activities to reduce idle labor and machinery.
Instead of panic or escalation, the agile structure enables calm, informed action.
Example 3: Change in Client Requirements
In a data center project, the client updates its performance specs for cooling systems after project kickoff.
- The “Interact” function enables technical discussion with the client to clarify intent.
- The “Check” function reassesses feasibility.
- The “Engineering” domain activates scenario modeling via the Digital Twin.
The result is collaborative redesign, not blame games or stalled approvals.
Example 4: Hand-Off to Operation
As commissioning ends, the O&M (Operations & Maintenance) team needs real-time documentation.
- The “Deliverables” tracked via Decision-Making Checklists ensure that all client-required items (as-built models, manuals, logs) are traceable.
- The “MTT Table” serves as a practical coordination platform between construction and O&M teams.
Here, the diagram ensures deliverables across the life cycle.
These cases demonstrate that the diagram doesn’t replace traditional processes — it enhances them by aligning stakeholders, increasing awareness, and accelerating response.
Whether it’s a technical conflict, a shifting timeline, or a new opportunity — the Agile EDM Conceptual Diagram makes complexity manageable and decision-making accountable.
Links Summary
- Digital Twin (Wikipedia): https://en.wikipedia.org/wiki/Digital_twin
- Digital Thread (Wikipedia): https://en.wikipedia.org/wiki/Digital_thread
- Decision-Making Checklists: https://edm.7x7x7.org/decision-making-check-lists/
- MTT – Master Tasks Table: https://edm.7x7x7.org/mtt-master-tasks-table/
- Tunnel Boring Machine (Wikipedia): https://en.wikipedia.org/wiki/Tunnel_boring_machine
- Oil Refinery (Wikipedia): https://en.wikipedia.org/wiki/Oil_refinery
- EPC Projects Introduction: https://edm.7x7x7.org/epc-projects/
Insights from Using the Agile EDM Diagram
The Agile EDM Conceptual Diagram offers more than structural clarity — it produces real insights into how engineering decisions should be approached in complex, evolving environments.
Here are five key insights gained from applying this tool across EPC project settings:
1. Engineering Decisions Are Not Isolated Events
They are the product of a system of functions — like “Monitor,” “Support,” and “Check” — interacting over time. By making this decision system explicit, the diagram improves both situational awareness and coordination.
Compare this to traditional project management, where decisions often “emerge” reactively. Agile EDM provides a deliberate framework for how, when, and by whom decisions are made.
Learn more about Agile Engineering Management as the context for decision-making.
2. Failure Often Comes from Disconnected Functions
Projects rarely fail because of one bad decision — they collapse when monitoring is weak, support is absent, or coordination breaks down. The diagram highlights these failure points and encourages proactive alignment of functions.
This reflects the Swiss Cheese Model of risk: multiple gaps, if aligned, allow failure to pass through.
3. It Enables Agile Without Chaos
Many teams associate “agility” with improvisation. But Agile EDM grounds agility in repeatable loops and structured logic, not personal heroics. The diagram helps you act fast without losing control.
See the comparison to classical structures in Standard Project Management.
4. It Makes Tacit Knowledge Explicit
The functions embedded in the diagram mirror what senior engineers do intuitively — they constantly scan, adjust, and interact. By mapping these instincts, the diagram allows less experienced professionals to operate at a higher level of awareness.
This supports the principles of knowledge engineering.
5. It Helps You See the Gaps
Sometimes, a project feels “stuck,” and no one knows why. Using the diagram as a diagnostic tool often reveals missing activity in one of the key functions — perhaps there’s no real-time monitoring, or support is reactive, or engineering is operating in isolation from operations.
The tool functions like a project MRI scan, revealing unseen dysfunctions.
In short, the Agile EDM Diagram is not just a model — it’s a thinking lens. It trains project teams to look beyond tasks and deadlines, and see the underlying dynamics that truly drive outcomes.
Links Summary
- Agile Engineering Management: https://edm.7x7x7.org/agile-engineering-management/
- Standard Project Management: https://edm.7x7x7.org/standard-management/standard-project-management/
- Swiss Cheese Model (Wikipedia): https://en.wikipedia.org/wiki/Swiss_cheese_model
- Knowledge Engineering (Wikipedia): https://en.wikipedia.org/wiki/Knowledge_engineering
From Concept to Practice — Why This Diagram Matters
The Agile EDM Conceptual Diagram is more than a visual. It is a thinking framework, a practical blueprint, and a shared language for engineering decision-making across the lifecycle of EPC projects.
Traditional project frameworks — such as those found in PMBOK — often emphasize activity flows and control charts. These are valuable, but they miss one crucial thing: the inner logic of engineering decisions.
The Agile EDM Diagram fills that gap. It doesn’t replace project management standards — it complements them by embedding agility where it matters most: in engineering workflows, decision gates, and inter-functional handovers.
Why is this important?
- Because standard functions (engineering, procurement, construction, operations, project control) work well in theory — but in real life, they often operate in silos.
- Because complexity, uncertainty, and delays emerge not from single errors, but from a lack of coordinated decision-making.
- Because agility without structure leads to chaos, and structure without agility leads to rigidity. This diagram helps you avoid both extremes.
More importantly, this diagram becomes a communication tool. It aligns engineers, managers, subcontractors, and clients around how decisions are made, not just what is delivered. When everyone sees the same logic — the loops, the support flows, the checkpoints — alignment becomes possible.
For teams working on high-risk, multi-stakeholder projects, this kind of shared mental model is priceless.
In the evolving world of EPC, you don’t need more control — you need smarter, more adaptive systems of decisions. And that’s what Agile EDM delivers.
Links Summary
- PMBOK (Project Management Body of Knowledge): https://en.wikipedia.org/wiki/Project_Management_Body_of_Knowledge
- Agile Engineering Management: https://edm.7x7x7.org/agile-engineering-management/
- Standard Project Management: https://edm.7x7x7.org/standard-management/standard-project-management/
Questions to Reflect On — Applying the Diagram (Questions for Reflection)
Understanding the Agile EDM Conceptual Diagram is just the beginning — its true value comes from how your team applies it. Use the following questions to spark discussion, identify blind spots, and strengthen engineering decision flows on your project:
- Where in our current process do engineering decisions often stall or get delayed?
Are these points visible on the diagram? Can we improve the flow? - Do we have a clear understanding of how each function (Engineering, Procurement, Construction, etc.) contributes to decision-making — not just execution?
Or do we still operate in functional silos? - Are our design loops iterative in practice, or only in theory?
Does the team know when to re-loop vs. move forward? - Do we have enough support functions (e.g., digital tools, expert reviews, benchmarks) reinforcing the decision points?
Or are decisions made with insufficient data or alignment? - Does everyone involved in engineering — including external stakeholders — share a common understanding of our decision logic?
Can we use the diagram as a shared reference? - How often do we revisit engineering decisions once new information emerges?
Does our system support such agility, or do we resist re-evaluation? - Are we using this diagram in practice — in meetings, onboarding, planning, and reviews?
Or is it just a theoretical artifact?
These questions aren’t just for project managers. They are for the entire team — engineers, analysts, modelers, clients, and contractors alike. The diagram is a lens through which every team can see the system, challenge assumptions, and make better, faster decisions.
Links Summary
- Deliverable: https://en.wikipedia.org/wiki/Deliverable
- Decision-Making: https://en.wikipedia.org/wiki/Decision-making
- Agile Engineering Management: https://edm.7x7x7.org/agile-engineering-management/
- Standard Project Management: https://edm.7x7x7.org/standard-management/standard-project-management/
- Agile Functions: https://edm.7x7x7.org/agile-engineering-management/agile-functions/
- Engineering Loops: https://edm.7x7x7.org/agile-engineering-management/engineering-loops/
ADVERTISEMENT
[ Placeholder for future Google AdSense block ]
Explore Key Topics of Agile Engineering
🌪️ Agile Engineering Management
Where Standard Functions End — Agile Engineering Begins
Discover why traditional management systems often fall short — and how Agile Engineering steps in to enhance clarity, speed, and performance across EPC projects.
🔗 Read more
🧠 Agile Engineering Functions
7 Functions You Didn’t Know You Needed
Learn about the seven core functions of Agile Engineering that help bridge the gaps between fragmented standard processes and real project needs.
🔗 Explore functions
🧰 Agile Engineering Tools
Practical Tools for High-Impact Decisions
Explore five essential tools that empower engineers to make faster, clearer, and more confident decisions in complex project environments.
🔗 Explore tools
📜 Agile Engineering Principles and Rules
7 Core Principles That Keep You on Track
Understand the foundation of Agile Engineering through seven principles and their practical rules, ensuring engineering decisions are always aligned and effective.
🔗 See principles
☑️ Functional Rules and Checklists
Turn Theory into Practice — Step by Step
Access practical checklists based on functional rules, ready to be tailored to your specific project environment for maximum operational benefit.
🔗 Use checklists
📊 Master Tasks Table (MTT)
Bring Order to Task Chaos
Master your project tasks with this unique system of task structuring — from boundaries and value to integration and technical debt management.
🔗 Discover MTT
🧵 Digital Thread
Connecting Decisions, Data, and Design
Coming soon: a new view on how your digital assets and engineering logic can stay connected across time and systems through a Digital Thread.
🔗 (Page in publishing progress)
🎯 Two Engineering Decision Paths: MVP vs Smart
Choosing the Right Path for Engineering Decisions in EPC Projects. In complex EPC (Engineering–Procurement–Construction) projects, engineering decisions vary widely in scope, impact, and context..
🔗 Read Topic